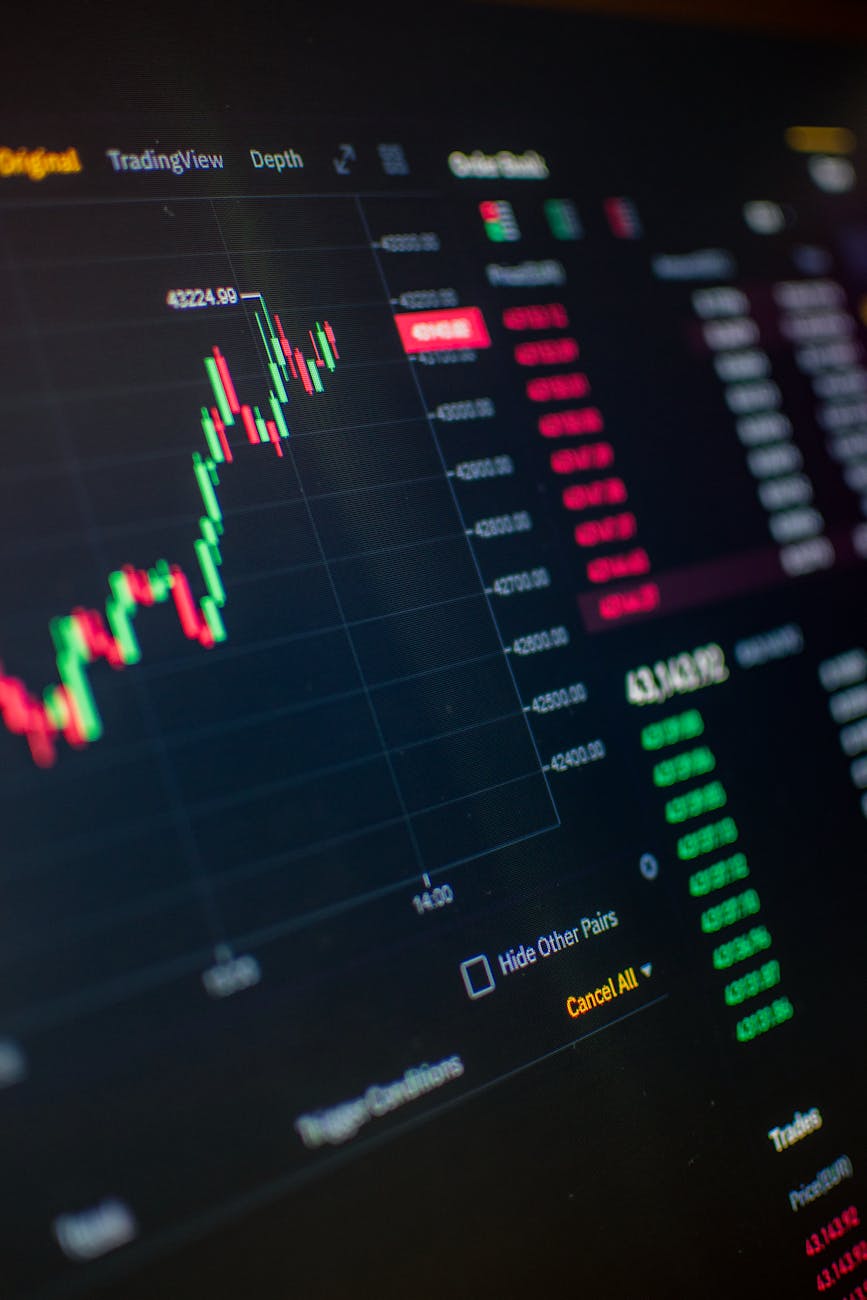
Introduction: The Ghost in the Trading Machine
You’ve spent months, perhaps years, mastering it all. You can spot a Bullish Engulfing pattern on a Nifty chart from a mile away. You’ve drawn your support and resistance lines with surgical precision. You understand moving averages, RSI divergences, and Fibonacci retracements. You have a trading plan printed and pinned next to your screen.
Yet, you still lose money.
The trade you entered with conviction is closed prematurely on a minor pullback out of fear. The losing trade you swore you’d exit at a 2% loss is now a 10% hole, held onto with a desperate prayer for a rebound. You watch in frustration as a stock you exited for a small profit rockets to new highs without you.
What is the missing piece? It’s not a technical indicator. It’s not a secret chart pattern.
The most important, yet least discussed, “chart pattern” is not on your screen. It’s etched into the neural pathways of your brain. It’s the pattern of your own emotions, your decisions, and your discipline under pressure. This is the pattern of Trade and Emotion Management.
For the Indian trader, navigating a market fueled by rumor, FOMO (Fear Of Missing Out), and the pervasive influence of “guru” tips, mastering this internal pattern isn’t just an advantage—it’s a survival skill. This article will map this invisible pattern, providing you with the tools to manage your trades and, more importantly, yourself.
Part 1: The Diagnosis – Why We Are Our Own Worst Enemy
Before we can fix a problem, we must acknowledge it. The battlefield of trading is not the NSE or BSE; it’s the six inches between your ears. Behavioral finance has proven that humans are wired with cognitive biases that are disastrous for trading.
The Indian Trader’s Psychological Pitfalls
- The “Sahi Baat Hai” Bias (Confirmation Bias):
- What it is: We actively seek out information that confirms our existing beliefs and ignore what contradicts them.
- The Indian Example: You buy a stock based on a tip from a YouTube “expert.” You then only watch videos or read news that paints the company in a positive light, dismissing any negative reports as “market manipulation.” You hold onto the trade as it falls, convinced your initial source was right.
- The “Kal Bounce Hoga” Fallacy (Hope over Reality):
- What it is: The inability to accept a loss, transforming a trader into an investor against their will.
- The Indian Example: Your intraday trade in Bank Nifty goes against you, hitting your stop-loss. Instead of exiting, you disable the alert, thinking, “It’s just a small dip. It will bounce back tomorrow (Kal Bounce Hoga).” The position remains open, and the loss deepens, turning a defined, small loss into a catastrophic one.
- FOMO (Fear Of Missing Out):
- What it is: The intense anxiety that everyone is making money except you, leading to impulsive, poorly-planned trades.
- The Indian Example: You see a stock like YES BANK or ADANI soaring 20% in a day, with your friends and social media buzzing about their profits. You jump in at the peak, without a plan, only for the stock to reverse. You are left buying the euphoria and selling the panic.
- The “Thoda Profit Pakad Lo” Mentality (Early Profit Taking):
- What it is: The urge to close a winning trade too early to “lock in gains,” driven by the fear that the profit will vanish.
- The Indian Example: You buy a stock at ₹100 with a target of ₹120. It moves to ₹105. You get nervous and sell, saying, “Thoda profit to pakad lo.” The stock then proceeds to hit ₹120 without you. You’ve cut your winners short, which is a recipe for long-term failure.
- The “Zerodha P&L Glitch” Denial (Averaging Down):
- What it is: Adding to a losing position to lower your average buy price, hoping for a smaller bounce to break even.
- The Indian Example: You bought RELIANCE at ₹2,800. It falls to ₹2,600. Instead of accepting the mistake, you buy more at ₹2,600, thinking, “Now my average is only ₹2,700. A small bounce and I’m out.” This is like throwing good money after bad and can lead to a concentrated, devastating loss.
These are not just mistakes; they are symptoms of an unmanaged emotional system. The first step to building a new pattern is to recognize these old, destructive ones.
Part 2: The Blueprint – Designing Your Unshakeable Trade Management System
A system provides rules, and rules provide emotional clarity. When the market is in chaos, your system is your anchor. Your trade management system must be built before you enter a trade and must be unbreakable.
The Three Pillars of Professional Trade Management
Pillar 1: The Pre-Flight Checklist (Before the Trade)
This is where 80% of trading success is determined.
- Define Your Risk Per Trade: This is the cornerstone. Never risk more than 1-2% of your total trading capital on a single trade.
- Calculation: If your capital is ₹1,00,000, your maximum risk per trade is ₹1,000 to ₹2,000.
- Why it Works: This ensures that even a string of 10 consecutive losses will not decimate your account. It removes the fear of any single trade.
- The Holy Trinity: Entry, Stop-Loss, and Target
- Entry: Be specific. “I will buy if the price closes above the resistance of ₹500 on the daily chart.”
- Stop-Loss (The Lifeboat): This is non-negotiable. It is not a suggestion; it is an automated order. Your stop-loss is determined by your pre-defined risk.
- Example: You buy a stock at ₹500. Your risk per share is ₹10 (2% of ₹500). Your stop-loss must be at ₹490. If the trade doesn’t work, you lose a predictable ₹10 per share, not a penny more.
- Target (The Destination): Define your profit-taking level based on technicals (e.g., next resistance level). This prevents you from getting greedy or exiting early out of fear.
- Calculate Your Position Size: This links your risk to your stop-loss.
- Formula: Position Size = (Total Capital * Risk %) / (Entry Price – Stop-Loss Price)
- Example:
- Capital: ₹1,00,000
- Risk per trade: 1% = ₹1,000
- Entry Price: ₹500
- Stop-Loss: ₹490
- Risk per share: ₹10
- Position Size = ₹1,000 / ₹10 = 100 shares.
- This precise calculation tells you exactly how many shares to buy. No guesswork.
Pillar 2: In-The-Trench Discipline (During the Trade)
Once the trade is live, your job is not to predict; it is to monitor and execute your plan.
- The “Set and Forget” Principle: Once your entry, stop-loss, and target orders are placed, walk away. Do not stare at the P&L flickering on your Zerodha terminal. This constant monitoring is the primary cause of emotional interference.
- No Moving Stop-Losses: The most destructive in-trade behavior is moving a stop-loss further away to avoid a loss. A stop-loss is only ever moved in one direction: to lock in profits (a “trailing stop-loss”), never to avoid a loss.
- The Journal is Your Mirror: For every trade, log the following in a journal (a simple Excel sheet will do):
- Date, Stock, Entry, Stop-Loss, Target, Exit, P&L.
- The Critical Addition: “Emotional State & Notes.” Were you fearful? Confident? Impatient? Why did you enter? Why did you exit?
- This journal is not for accounting; it’s for diagnosing your emotional patterns.
Read more: Nifty 50 vs Sensex: What India’s Market Indicators Reveal About the Economy
Pillar 3: The Post-Mortem Analysis (After the Trade)
The trade is over, but the learning has just begun.
- Review Objectively, Not Emotionally: A winning trade can be a bad trade (e.g., you took excessive risk and got lucky). A losing trade can be a good trade (you followed your plan and got stopped out correctly).
- Analyze Your Journal: At the end of the week, look for patterns. Do you consistently exit winners too early? Do you hold losers? Do you trade more aggressively on Fridays? This data is gold.
- Focus on Process, Not Outcome: Praise yourself for following your system, regardless of the P&L. Berate yourself for breaking your rules, even if the trade was profitable. This reinforces the right behavior.
Part 3: The Invisible Pattern – Mapping and Managing Your Emotions
Your trade management system is the hardware. Your emotional management is the software that runs it. Let’s debug the most common emotional viruses.
1. Taming Fear and Greed: The Two Headed Monster
- The Antidote to Fear (of Loss): Your pre-defined 1% risk rule. When you know the worst-case scenario is a small, manageable loss, the fear dissipates. Fear is a function of the unknown; your system makes the risk known.
- The Antidote to Greed (and FOMO): Your position sizing and target. When a stock is rocketing and you feel FOMO, your system’s answer is: “Does this setup fit my criteria? What is the risk? What is the position size?” If it doesn’t fit, you don’t trade. Greed cannot argue with a mathematical formula.
2. Dealing with Euphoria and Overconfidence
A winning streak can be more dangerous than a losing one. It can lead you to believe you’re invincible, causing you to abandon your system, increase position sizes recklessly, and take low-probability trades.
- The Antidote: Stick rigidly to your position sizing formula. No matter how many wins in a row, the next trade still only risks 1%. Furthermore, after a big win, take a short break. Do not let euphoria fuel your next decision.
3. Managing Frustration and Revenge Trading
A losing trade, especially a few in a row, can trigger frustration and a desire to “make the money back quickly.” This leads to revenge trading—entering trades without a plan, often with larger sizes, to recoup losses.
- The Antidote: This is the most crucial test. When you hit a pre-defined daily loss limit (e.g., 3% of your capital) or two consecutive losses, stop trading for the day. Shut down your terminal. Go for a walk. The market will be there tomorrow. Revenge trading is the fastest way to blow up an account.
Part 4: The Trader’s Mindfulness Toolkit – Practical Exercises
This isn’t theoretical. Here are actionable exercises to rewire your brain.
- The Pre-Market Meditation (5 Minutes): Before the market opens, sit in silence. Focus on your breath. Set your intention: “Today, I will follow my plan. I will embrace my losses. I will not chase prices.” This creates a buffer between your reactive mind and the market’s noise.
- The “If-Then” Planning: Script your responses to market events.
- “IF my trade hits my stop-loss, THEN I will accept it as a cost of business and not re-enter for at least 2 hours.”
- “IF I feel the urge to move my stop-loss, THEN I will close my chart for 30 minutes.”
- This technique, known as implementation intention, automates disciplined behavior.
- The Power Pause: When you feel a strong emotion—panic during a drawdown or FOMO during a spike—physically push back from your desk. Take three deep breaths. Ask yourself: “What does my system say to do right now?” This creates a space for your rational brain to intervene.
Conclusion: Becoming the Pattern
The journey to consistent profitability in the Indian stock market is not a search for a better indicator. It is a journey of self-mastery. The “chart pattern” of trade and emotion management is the only one that guarantees you will survive long enough for your technical edge to play out.
You now have the blueprint:
- A System to manage your trades (The 1% Rule, The Holy Trinity, Position Sizing).
- A Framework to manage your emotions (Diagnosing Biases, The Mindfulness Toolkit).
- A Process to ensure continuous improvement (The Trading Journal).
This is the quiet work that happens off the charts. It is unglamorous. It won’t get you likes on social media. But it is what separates the perpetual loser from the professional, the gambler from the disciplined trader.
The goal is not to eliminate emotion—that is impossible. The goal is to recognize your internal patterns and build a system so robust that your emotions cannot sabotage it. Start today. Print out your rules. Open your trading journal. Take the first step toward not just reading the market, but reading yourself.
Read more: How to Read Candlestick Charts: A Beginner’s Guide (Indian Examples)
Frequently Asked Questions (FAQ) Section
Q1: This sounds good, but can you really make money only risking 1%? The profits would be tiny.
A: This is a common and dangerous misconception. The power of the 1% rule is not in a single trade, but in compounding and survival. If you risk 1% to make 3% (a 1:3 Risk-Reward ratio), a 50% win rate is highly profitable. More importantly, if you risk 10% per trade, just two losing trades will wipe out 20% of your capital, making a comeback incredibly difficult. The 1% rule ensures you live to fight another day, allowing the math of your strategy to work over hundreds of trades.
Q2: I set a stop-loss, but it always gets hit and then the price reverses in my direction. What should I do?
A: This is the “trader’s remorse” and is very common. First, if this happens frequently, your stop-loss placement may be too tight—place it beyond obvious market “noise” or recent swing lows/highs. Second, and more importantly, you must reframe your thinking. A stopped-out trade is a successfully managed trade. You controlled your risk. The market’s subsequent movement is irrelevant. Chasing the trade after it reverses often leads to buying high and selling low. Trust your process, not the outcome of one trade.
Q3: How do I control the urge to check my P&L every minute?
A: This urge stems from an emotional attachment to the money. The solution is to detach.
- Use an Equity Curve Chart: Instead of looking at trade-by-trade P&L, look at a weekly chart of your total capital. This shifts your focus from short-term noise to long-term growth.
- Place Orders and Walk Away: Once your orders are set, close the trading terminal. Set an alert for your stop-loss or target if you must, but physically remove yourself from the screen.
- Focus on Units, Not Money: Think of your position in terms of “risk units” (e.g., 1 unit = 1% of capital), not rupees. This depersonalizes the money and makes it a game of executing a system.
Q4: I follow my plan, but a string of losses is demotivating. How do I stay disciplined?
A: This is the ultimate test. First, understand that losing streaks are a mathematical certainty in any probabilistic game. If your system has a 60% win rate, a string of 5 losses is inevitable over a large sample size.
- Go Back to Your Data: Review your trading journal and historical backtests. Remind yourself that your system is profitable over the long run.
- Reduce Size Temporarily: If losses are affecting your psychology, consciously reduce your risk per trade to 0.5% until your confidence returns.
- Take a Break: Sometimes, the best trade is no trade. A short break can reset your mindset.
Q5: Is it better to use a mental stop-loss or an actual automated order?
A: For 99.9% of traders, especially in the fast-moving Indian market, an automated stop-loss order is mandatory. A mental stop-loss is a fantasy. When the price is crashing and fear takes over, your “mental” stop will be ignored, and a small loss will become a large one. The automated order is your system’s immune system—it works automatically to protect you from yourself.
Q6: How long does it take to build this discipline?
A: It’s a lifelong practice, not a destination. You will never be perfectly disciplined. The goal is to be more disciplined today than you were yesterday. The first 3-6 months of consciously applying these principles are the hardest, but it’s when the most significant neural rewiring occurs. Consistency is key.
Q7: Where can I find a good trading journal template?
A: Many are available online. A simple Excel/Google Sheets template should have the columns mentioned in Part 2. Zerodha’s backoffice and Varsity platform also have tools and resources to help you track your trades. The specific tool doesn’t matter; the consistent act of journaling does.
Disclaimer: This article is for educational purposes only and is a guide to developing trading discipline and psychology. It is not investment advice. Trading in the stock market involves substantial risk of loss and is not suitable for every investor. You should carefully consider your investment objectives, level of experience, and risk appetite before deciding to trade. Past performance is not indicative of future results. The author and publisher are not responsible for any financial losses resulting from the use of this information.
Read more: How to Read a Candlestick Chart: A Practical Guide for Indian Market Conditions
Leave a Reply